Welcome To Jekyll
Crime development in San Francisco within the decade (from 2008 to 2018)
San Francisco, located on the west coast of the United States in the northern part of California, is a diverse city. People from all over the world have chosen to call this city their home. San Francisco is an extremely captivating place, but it also faces challenges in terms of crime. By analyzing crime data from recent decades, we can reveal patterns and trends. In this study we will focus on crime patterns in the period from 2008 to 2018. This will give us insight into significant changes and highlight areas of concern. Politicians have encountered many problems regarding criminal activities in the area over the past decade, therefor utilization of this data can aid fighting serious crimes by which security and safety will be increased in the society.Calendar heatmap
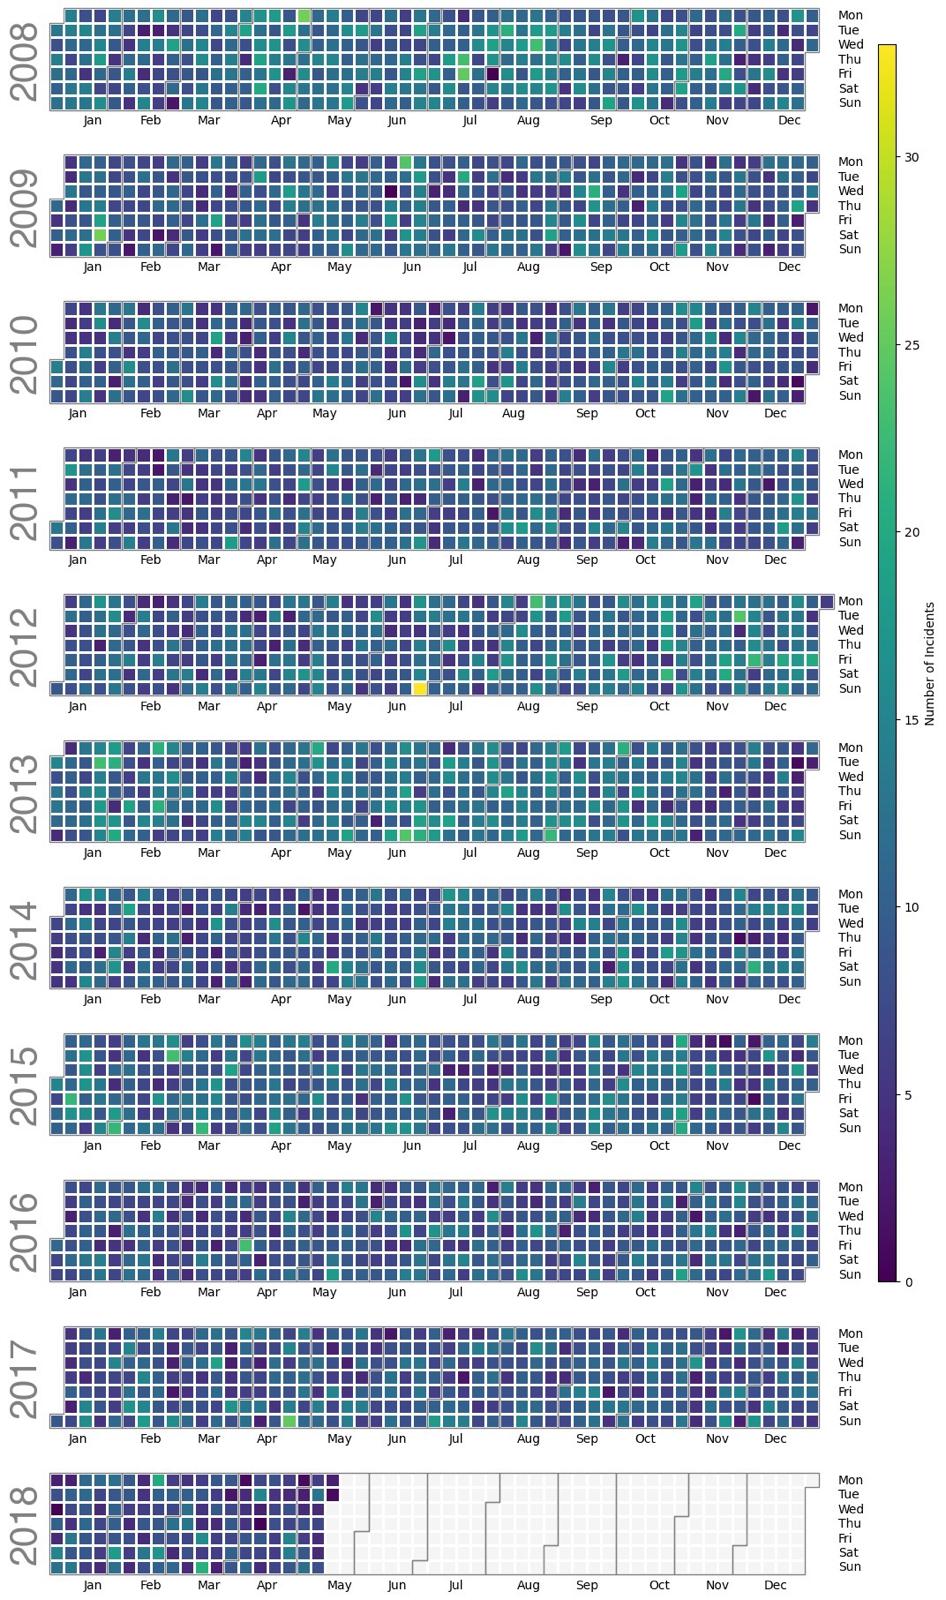
Here is a calendar heatmap for the crime type 'Robbery' in San Francisco in the period 2008 to 2018. Each square in the calendar represents one day, and the blocks of squares make up the years. On the right side of the plot is a color scale that visually indicates the number of events. Where the darker shades indicate a higher frequency of events. This type of plot provides a comprehensive overview of temporal patterns and trends in the occurrence of robberies in the period from 2008 to 2018.
Map display
After analyzing the general temporal patterns and trends in the incidence of robbery from 2008 to 2018, we now turn our attention to data with a visual representation of the areas where crime most frequently occurs. This allows us to identify crime patterns in relation to specific locations.The map displays an arrest related to robbery during the period from 1st January 2018 to 1st July 2018. In addition, the arrest is marked on the map as a red dot. This shows a good visualization of which area has or has the most crime in San Francisco and needs an extra eye for the area. We only used small amounts of data instead of 10 years of data, as 10 years of data would be too large to visualize on the map as seen below.
After researching crime in the area, it is also interesting to know when it occurs most frequently and what types of crime are most common.
Hourly Crime Counts
The San Francisco data set is a large dataset; it includes different types of data such as crime type, the location of crimes, time zone for crimes and etc. Analyzing this dataset provided detailed information about each crime type which can be used for statistical analysis and help officials to predict patterns and be prepared for probable crime in each area. On the interactive bokeh plot we can compare how the distribution of crimes differs from each other, and compare crime numbers which were computed per hour. X-axis shows the time of the day enumerate from 1 to 24 and Y-axis shows the counted crime per hour and on the right side of the plots we have different crime types and by clicking on each crime we are able to see the corresponding crime count as well as the time of crime. Therefore this plot will offer an easier overview of crime rate and make it more comparable for users.Based on the three plots, it gives us insight into different aspects of crime in San Francisco. This gives us a picture of crime increasing over time. We can also identify specific areas and times when there is a need for increased attention from the officials. This information can also be used for prediction purposes and provide an outline for crime rate in future and assisting authorities to devise preventive plans to minimize the crime rate.